
Markets and Asset Allocation in 2021
If one fell into a beauty sleep on January 1, 2020, and woke up December 31, 2020, to look at the S&P 500 and NASDAQ, they would be unhappy about “missing” out on one of the best stretches of economic growth in years. Then if they were to look at GDP growth projections for 2021 of 5.5% in the US and 5.8% globally, they would be extremely happy to wake up for one of the strongest economic expansions in decades. Everything is awesome.
We obviously know reality is very different. While equity markets had a great year and tech stocks had their best year since March 2000, the year 2020 will be remembered as one of the worst years in decades and one that most of us would probably want to forget. The human cost and suffering globally was overwhelming. We discovered that we are vulnerable to events previously thought to only happen in distant lands or emerging countries. As strong as we are militarily, we can’t shoot a virus that is attacking our citizens.
With all the pain, there was also good. We learned how Americans can unite and rise to the challenge when a common enemy threatens our families. We become more resilient, more human, passionate about helping others, and creative. Business owners and entrepreneurs found new ways to innovate and found new solutions to overcome the challenges.
Today, in early 2021, there are still many unknowns, and it still feels like a continuation of 2020. Investors should use this period of relative calm in markets to review and plan their asset allocation for the next few years.
US Economy
Based on most economists’ assessments, world growth and US growth in 2021 should be strong at around 5% and possibly higher. Earnings growth is expected to be very strong, around 20% in the US and Europe. These forecasts are mostly based on expectations for strong pent-up demand and additional monetary stimulus from governments in the developed world. While this is definitely possible, I’m a bit more skeptical.
My main challenge is with the many anomalies we see in the data. In 2020, the US government provided a bridge via massive monetary and fiscal stimulus, funding the collapse in demand due to the pandemic. This massive intervention in markets distorted much of the data and trends we would usually use for forecasting. Here are a few examples:
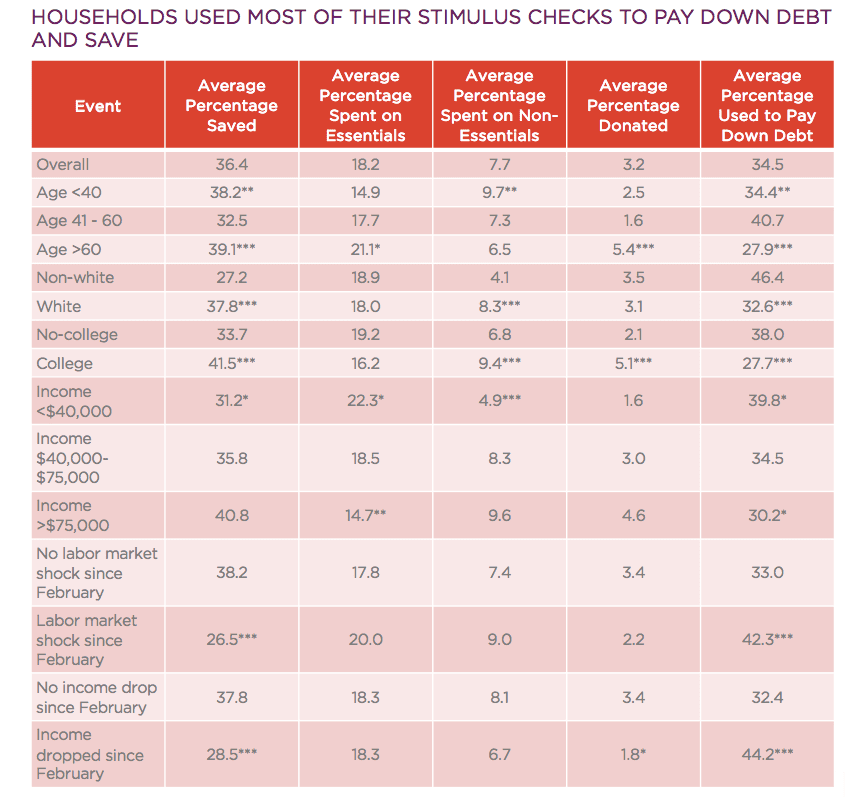
- The stimulus didn’t work the way decision-makers thought it would. A study by the Federal Reserve Bank of New York found that 75% of the stimulus money went to savings and paying down existing debt. This is something nobody expected from US consumers, and still, many economists base their forecasts on money from the next stimulus to go mostly into consumption.
- In three months, we increased our deficit more than the total increase in the last five recessions together.
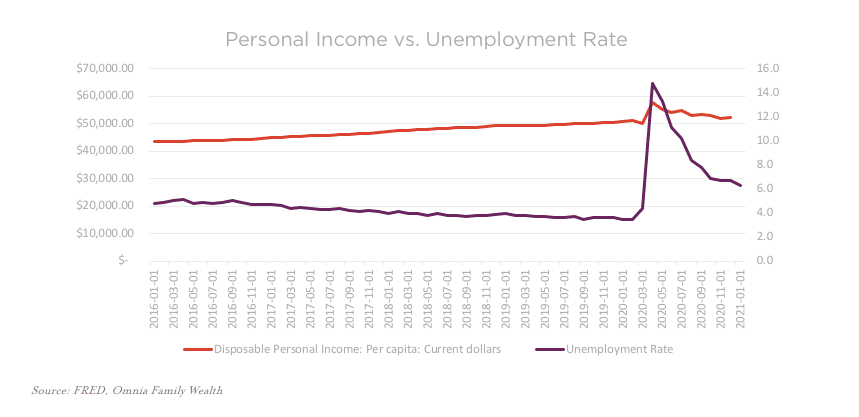
- In 2020, we saw the largest increase in personal income, while at the same time, we saw massive layoffs.
- Since 2018 and especially in 2020, M2 (Money Supply) to nominal GDP grew by 25X, while at the same time M2 velocity collapsed.
- In the 2020 recession, corporate debt increased by $400B, as opposed to the 2008 recession, when corporate debt decreased by $500B.
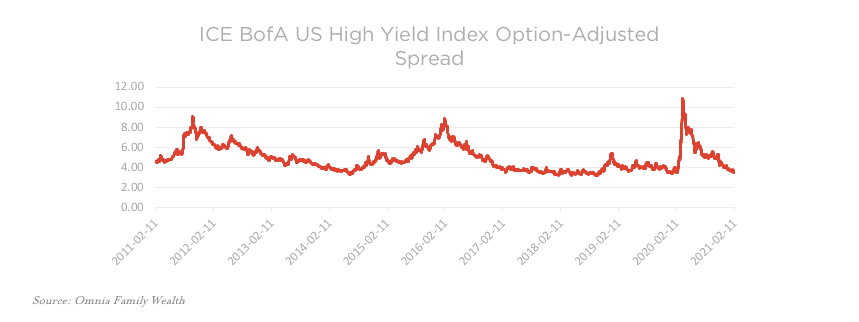
- High-yield credit spread over treasuries went negative in real terms for the first time in history.
- With all the stimulus, it is hard to quantify how much debt servicing will be coming out of the economy. I haven’t seen any economists adding this factor into their forecasts.

In the chart below, from September to November, personal income fell by 10% annualized. This is a result of the fading effect of the PPP program. At the same time, unemployment is decreasing.
US Inflation
Inflation in the US is something we all hear about a lot lately. We wrote our thoughts on inflation in a recent memo, Inflation or Deflation and the Transition Mechanism. In February, the US 10-year breakeven inflation rate reached its highest level since 2014, suggesting long-term bond yields could be heading higher. If we see breakeven go higher, at some point, the Fed will have to make it clear to investors what is the “tolerable” level of inflation over the 2% inflation target. Because we keep getting many questions about inflation, and because inflation is such an important and misunderstood topic, I will dedicate the next memo to the topic.
US Equities
Investors are excited for the new round of stimulus and by progress in the rollout of the vaccine. Also, positive data on the vaccine effectiveness coming out of Israel is encouraging investors.
After the dip in March 2020, US equities had a huge run-up. At these levels, US equities as a whole are expensive. Whatever method you use to value them, they are expensive. Growth stocks and small caps are ridiculously expensive (with some exceptions). But this doesn’t matter because stocks stopped trading on fundamentals; instead, they are trading based on euphoria and excessive liquidity, so we could see markets go even higher. All we know is that investing based on hopes for more liquidity isn’t a successful, long-term strategy. This market environment reminds us of the tech bubble in 1999. That environment was described well by Scott McNealy of Sun Microsystems a few years later:
“At 10 times revenues, to give you a 10-year payback, I have to pay you 100% of revenues for 10 straight years in dividends. That assumes I can get that by my shareholders. That assumes I have zero cost of goods sold, which is very hard for a computer company. That assumes zero expenses, which is really hard with 39,000 employees. That assumes I pay no taxes, which is very hard. And that assumes you pay no taxes on your dividends, which is kind of illegal. And that assumes with zero R&D for the next 10 years, I can maintain the current revenue run rate. Now, having done that, would any of you like to buy my stock at $64? Do you realize how ridiculous those basic assumptions are? You don’t need any transparency. You don’t need any footnotes. What were you thinking?” Scott McNealy, Business Week, 2002.
An approaching test for the market is the 10-year yield. If the yield keeps going higher, it will soon pass the dividend yield of the S&P 500.
Markets have stopped trading on fundamentals and are now trading on social mood and liquidity.
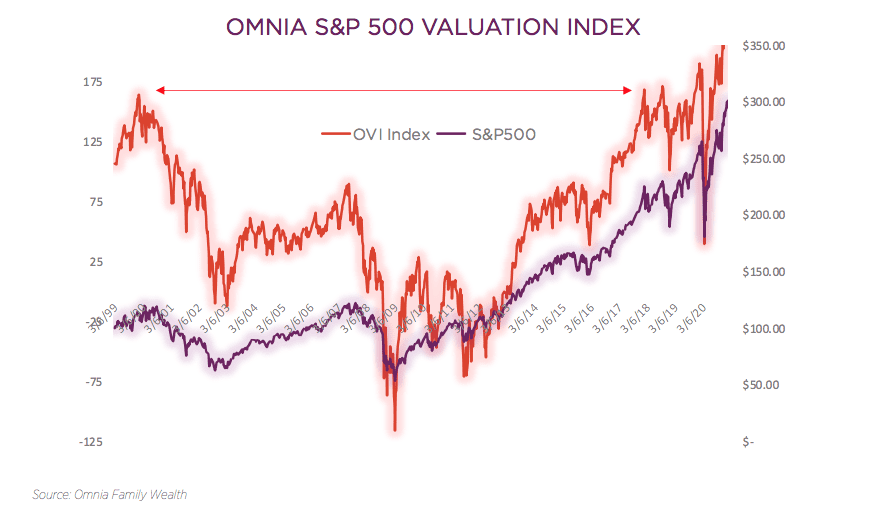
As shown in our valuation chart above, the valuation on the S&P 500 first reached its 2000 levels back in January 2018. Since then, the market was able to sustain and surpass these levels only with the Fed’s help.
In the chart below, we see another extreme. The number of individual stocks outperforming the S&P 500 index is dropping fast.
At this point, it is most important to focus on liquidity, as that is what is driving markets. Currently, the Fed is providing about $120 billion a month in liquidity. If the government’s budget deficits keep increasing quickly and start pushing up the 10-year treasury yield, we could see the Fed injecting much more than $120 billion a month so the government can keep financing those deficits at low interest rates. And prevent a market crash.
International Developed Equities
The largest components in developed markets’ (ex US) indices are Japan and Europe. The European Union has a leadership vacuum, demographic challenges and heavy debt issues in some key countries. I also think the financial market recovery is well ahead of the economic recovery in Europe. These are some of the reasons we try not to invest in developed markets indices/ETFs and have been significantly underweight European equities for the last two years and will probably keep a similar allocation for the foreseeable future. With that said, I do believe we will see attractive opportunities on the distressed side in equity and debt as well.Japan, while having similar challenges to other developed countries, has the advantage of being a key player in the Asian market, which we think will be growing rapidly in the next few decades. It has a current account surplus and is internally funded. In addition, Japan’s private sector has been deleveraging for several decades now, and Japanese stocks in dollar terms are significantly undervalued.
But what could really be a game-changer for Japanese equities is growth and inflation in its key Asian partners. Higher inflation in Japan (through imports) will force Japanese institutions to (finally) reallocate to domestic equities out of local government bonds.
Emerging and Asian Equities
There’s a significant difference in our growth projections between some emerging markets countries part of the MSCI EM index. For this reason, we think an overweight to some countries and regions would be a better way to allocate capital. Emerging markets and emerging Asian countries such as Vietnam, South Korea and Singapore in particular, had strong performance since March 2020, and still we believe a correction in these markets should be viewed as an opportunity to increase exposure to these markets.
China
We wrote many times about the risks that come with investing in Chinese equities, and there are still many to consider. There is China’s relationship with the US and the US Dollar, the dispute in the South China Sea and the low confidence in China’s belt and road initiative, which is very important for China. But we think in some cases, headwinds are turning into tailwinds, and Chinese equities have possibly started a new bull market back in April 2020.
Inflows
Last year was an important year for foreign direct investment in China, as it surpassed that of the US, according to the UN. China is now the world’s largest recipient of foreign companies’ investments. The trend actually started in 2019 but accelerated in 2020 due to COVID-19.
We also saw significant inflows into Chinese sovereign debt. As an example of a potential changing mindset about Chinese debt, Japanese investors in the first nine months of 2020 sold Indian and South American debt and bought 420 billion yen ($4 billion) of Chinese sovereign bonds.
Long-Term Planning
China recently released its 14th five-year plan and its 2035 long-term vision. The plan sets targets for the medium- to long-term development. From its plan, we learn that China is looking to invest heavily in technologies such as quantum computing, artificial intelligence, life science, crop breeding and space. In addition, the plan addresses new developments in infrastructure, natural resources, technology, finance and ecosystems. China also set a goal to achieve carbon neutrality by 2060. China will have to invest heavily in areas such as green energy projects, smart grid technologies and recycling to achieve this ambitious target.
Another important development is that ASEAN (The Association of Southeast Asian Nations) became China’s largest trading partner and surpassed the US and the European Union. In addition, 15 economies in the Asia Pacific region signed the Regional Comprehensive Economic Partnership (RCEP) that would substantially increase economic integration and collaboration.
Monetary Policy
Compared to the massive fiscal and monetary stimulus launched by the largest central banks, the PBOC’s response was very limited (M2 to Nominal GDP is the same as it was three years ago). China increased its fiscal deficit ratio to above 3.6% to fight COVID-19, but it will be reducing it back to around 3%. China’s fiscal deficit ratio has never exceeded 3% since the 1980s.
There are also signs that China will continue to keep opening the financial sector and facilitate foreign investment in RMB financial assets in 2021.
Local Equities
China’s local equity market (A-shares) is one of the least efficient markets. It is largely comprised of smaller, more entrepreneurial companies responsible for China’s economic reform. The main investors in this market are local individuals who are responsible for about 80% of the daily trading volume. The A-share market is also difficult and expensive to access and subject to regulatory risk. But while accounting for the higher risk, the A-share market offers significant opportunities for investors with the right access in the long run.
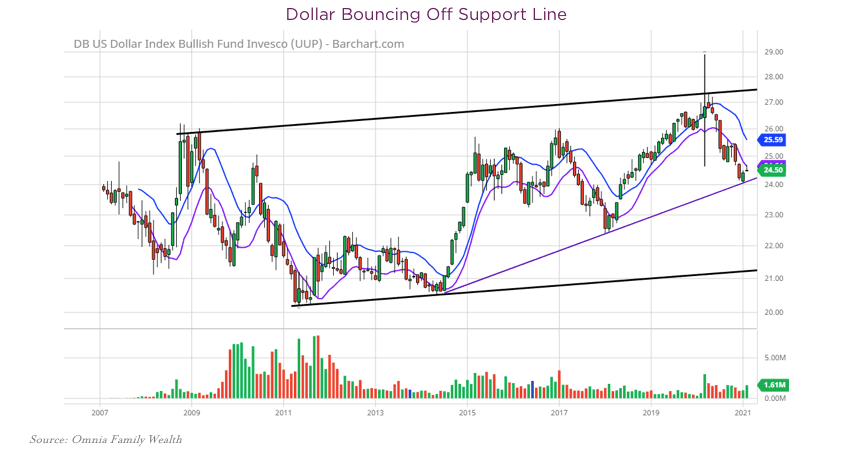
US Dollar
The US dollar is perhaps the most important asset to follow. As it is the world’s reserve currency, changes in its value could have significant implications on markets. Strengthening US dollars is negative for global growth.For the last year, there has been much commotion around the weakness of the dollar and its status as a reserve currency, but looking at its performance since 2011, we can see that it is actually still in an uptrend, and the recent weakness is still part of a normal and expected correction. In January 2021, the US dollar touched and bounced off the trend line that started in 2014 (for the third time). If it continues going higher, we could see a correction in emerging markets equities but also US equities.
We totally get the arguments in favor of a long-term dollar depreciation due to the US’s growing deficits, but it’s important to remember that other major currencies are in a similar or worse situation, and because a value of a currency is always relative, investors might favor the least dirty shirt.
Another reason for potential strengthening of the US dollar is when the Treasury issues large amounts of debt this year, the Fed doesn’t absorb them fast enough. This could really put rates higher and squeeze the dollar higher.
Commodities
We intend to increase our exposure to commodities in 2021. Our forecast for emerging markets also supports the price of commodities. We expect to see from China and other Asian countries strong demand as we saw in 1970 and 2000. In addition, the government’s climate change initiatives will support additional demand. For example, increasing demand for electric vehicles (they use four times the amount of copper; same in the case of upgrading the electrical grid) and other clean energy projects.
Technology
Technology and innovation is one of the topics I get really excited when talking about. Putting valuations aside, the level of innovation we see is just staggering. We see technologies that only a few years ago would be considered science fiction. Also, the effects of the sector’s innovation are broadening every year. Microsoft’s CEO described it well on the company’s earnings call on January 26. “What we have witnessed over the past year is the dawn of a second wave of digital transformation sweeping every company and every industry,” said Satya Nadella, chief executive officer of Microsoft.
Technology is an area we intend to focus on a lot in the coming years, specifically on venture.
Currency war
Anemic growth and high levels of debt create a fruitful ground for currency wars as countries become desperate, looking to inflate their debt by devaluing their currency. While we are currently not there, it is a scenario we should consider. As we said, we expect growth in Asian and emerging economies to be stronger than developed economies, which will cause their currencies to appreciate, which will then hurt their growth.
Another potential tension to watch for is around the ability of countries to print money. China, Russia and the EU want the ability to print money. Since they can’t print dollars, they want their biggest imports, energy, to be priced in their local currency instead of US dollars so they can print money for oil. What this effectively means is that the US will find it much harder to finance its current account deficit, so expect a strong US pushback.
Fixed Income Markets
Following the Fed’s (and other central banks) massive intervention in bond markets in 2021, investors are currently assessing the Fed’s next moves to guide their capital deployment. The Fed’s moves will be anything but surprising. The Fed has already told us that interest rate policy will be guided by the change in inflation expectations, based on its new objective, and balance sheet tapering based on the unemployment levels. Interest rates hikes are probably a few years down the road, but based on GDP growth expectations, tapering conversations could start toward the end of 2021.
Investment-grade bonds are being perceived to have a Fed backstop and are priced accordingly. At these levels, we think the risk/reward is very poor.
In the high-yield market, investors are expecting a 12-month default rate of less than 3%, which is historically low, while at the same time over 9% of high-yield bonds are priced 1000 basis points over treasuries (distressed pricing).
It is very important for fixed income investors to understand the interests of the Treasury and the Fed, and why there’s a conflict in their actions to get to the same result, which we discuss in this memo, “Competing for Liquidity: Financial Markets vs. the Treasury Department.” It is also important to understand that the Fed, by committing to achieving 2% and higher inflation, is publicly saying basically that they are looking to hurt bondholders.
Where are long rates headed?
We have been holding long-term treasuries for several years now, but as we wrote a few months ago, our work suggests there’s increasing probability for long-term rates to rise, and even if they do not, long-term treasuries would not be a good risk buffer in portfolios. We expect to see in 2021 unprecedented amounts of sovereign debt issues, which will put additional pressure on yields, and at the same time, we see that there’s lower-than-expected demand for long-term treasuries. We were actually very surprised to see limited demand for long-term treasuries as the COVID-19 pandemic was breaking out and equity markets were falling hard. The US can probably increase demand for the long-treasuries if they offer higher interest rates, but such a move could drive long-duration assets lower, including equities and high-yield bonds.
From yield curve control to everything control
If we do see higher yields, another potential move by central banks would be yield curve control. In a yield curve control, the Fed would keep the yield on certain maturities at pre-determined levels by purchasing bonds as needed. There are three main risks with this policy. 1.) While this policy could be helpful in the short term as the economy still recovers, there’s a risk of instability once fundamentals change and there’s a conflict between fundamentals and the policy. 2.) While the Fed could be successful in controlling the yields in several maturities of treasuries, the amount of debt and leverage in our financial system could bring yields in other segments in the fixed income markets (ABS, mortgages, Corporates, REPOs) to rise, bringing the Fed to intervene/control them as well. 3.) A yield curve control will basically distort risk pricing to all risk assets. But repricing of risk will have to happen at some point.
2021 Portfolio Positioning
Building portfolios is as much art as science. The numbers will never give a full, accurate picture of the present, let alone predict the future. Instead, our research helps us assign probabilities and magnitudes to different scenarios in different markets and assets. We then take the outcomes through the asset allocation process.
We have developed the G.R.I.D. asset allocation methodology after studying the long history of financial markets and learning that the most important and powerful element is understanding what economic environment we are in and into which environment we are possibly heading. We believe this methodology is critical for anyone building a long-term portfolio today. There are long-term tectonic shifts in power and growth developing between the west and the east that are important to understand and that most asset allocation methodologies will not be able to capture. Most portfolios are not equipped to handle a secular change in growth and interest rates.
Geographic diversification will be critical in the coming years to achieve returns and balance the risks. Emerging Asian countries will contribute 2.5 times more GDP global growth than that of the US and Europe combined, and it should be reflected in portfolios.
As we mentioned, commodities should be an important part of portfolios, but some should do much better than others. So an over/underweight to some is preferable.
Investors should study and use volatility as an asset class. Negative correlations are the most desired function in asset allocation, but it’s becoming hard to find.
Growth and yields in most assets are very hard to come by without taking excessive risks. Low beta hedge fund strategies such as relative value, fixed income arbitrage and volatility arbitrage could be a good addition to fixed income allocations.
Fixed income investors need to understand that, opposed to equity investors, the Fed is NOT their friend. Yes, the Fed has to keep rates low, but they are also targeting higher inflation. Both can’t live together for long.
Click here to download the PDF.
Important Information
Omnia Family Wealth, LLC (“Omnia”), a multi-family office, is a registered investment advisor with the SEC. This commentary is provided for educational and informational purposes only. It does not take into account any investor’s particular investment objectives, strategies, tax status, or investment horizon. No portion of any statement included herein is to be construed as a solicitation to the rendering of personalized investment advice nor an offer to buy or sell a security through this communication. Consult with an accountant or attorney regarding individual tax or legal advice.
Advisory services are only offered to clients or prospective clients where Omnia Family Wealth and its representatives are properly licensed or exempt from licensure. Information in this message is for the intended recipient[s] only. Please visit our website https://omniawealth.com for important disclosures.
This content is provided for informational purposes only and is not intended as a recommendation to invest in any particular asset class or strategy or as a promise of future performance. References to future returns are not promises or even estimates of actual returns a client portfolio may achieve.
The views expressed herein are the view of Omnia only through the date of this report and are subject to change based on market or other conditions. All information has been obtained from sources believed to be reliable, but its accuracy is not guaranteed. Omnia has not conducted an independent verification of the data. The information herein may include inaccuracies or typographical errors. Due to various factors, including the inherent possibility of human or mechanical error, the accuracy, completeness, timeliness and correct sequencing of such information and the results obtained from its use are not guaranteed by Omnia. No representation, warranty, or undertaking, express or implied, is given as to the accuracy or completeness of the information or opinions contained in this report. This report is not an advertisement. It is being distributed for informational and discussion purposes only. Omnia shall not be responsible for investment decisions, damages, or other losses resulting from the use of the information. This report is not intended for public use or distribution. The information contained herein is confidential commercial or financial information, the disclosure of which would cause substantial competitive harm to you, Omnia, or the person or entity from whom the information was obtained, and may not be disclosed except as required by applicable law.
Statements that are non-factual in nature, including opinions, projections, and estimates, assume certain economic conditions and industry developments and constitute only current opinions that are subject to change without notice. Further, all information, including opinions and facts expressed herein are current as of the date appearing in this report and is subject to change without notice. Unless otherwise indicated, dates indicated by the name of a month and a year are the end of the month.
Have Questions for An Advisor?
RELATED ARTICLES

THE CATCH-22 OF INVESTING IN ARTIFICIAL INTELLIGENCE
Read More
PRIVATE CREDIT: DATA, DISCIPLINE, AND DIVERSIFICATION
Read More
IT’S TIME FOR HEALTH CARE TO PUT BRAIN HEALTH FRONT AND CENTER
Read More
PRIVATE CREDIT: OPPORTUNITY AND THE CRITICAL ROLE OF MANAGER SELECTION
Read More
BEYOND THE HEADLINES: HOW GEOPOLITICS MOVES MARKETS
Read More
TRUMP’S TARIFF STRATEGY: A Comprehensive Overview
Read More
The Exit Trap: Avoiding the Illusion of Forever Wealth
Read More