

The Other Side of Real Estate Investments
Real estate and its sectors is one of the most important asset classes in long term portfolios, and for good reason. With a thought out strategy, there could be many advantages to investing in real estate, including wealth preservation, stable cash flow, appreciation, tax benefits through depreciation and long-term capital gains. The most compelling reason, the one I hear from investors over and over again, is that it’s simple to understand and replicable.
Since the 2008 financial crisis, real estate has become a substantial part of investors’ wealth. For some, it’s their main business, for others it’s through their investment portfolio.
Cap Rates
To better understand the current environment in any industry, I like to speak to colleagues, friends and industry professionals, and one of the things I hear more recently, is that it’s getting harder and harder to find good deals, where the returns can justify the risk. This fits well with my own observations.
Years of strong demand pushed yields to record lows in many places and property types around the world. For example, office cap rates in New York and London are around 3.5 percent and in Hong Kong and Tokyo office cap rates are below 3 percent. And what I see in places like Vancouver and Toronto is becoming a real concern.
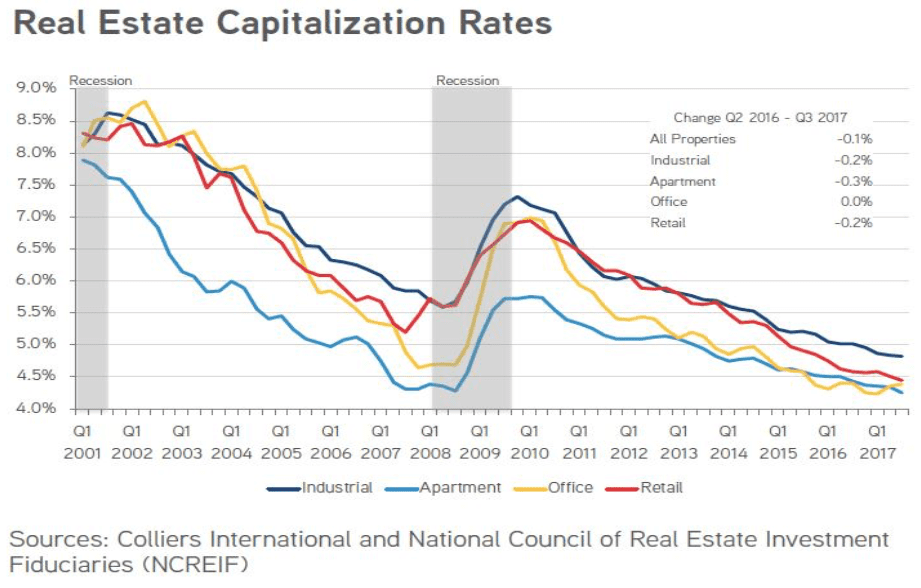
Despite all this, I do not think this market environment has the makings of a boom and bust cycle as we experienced in 2008. As I mentioned in my Current Private Equity Markets and the Internal Rate of Return Fallacy piece, there is a tremendous amount of capital seeking returns in the PE space and that includes the real estate market. This could support the market and keep cap rates low for a long time.
But what today’s low cap rates do tell us is that property values could potentially see slower growth and many sectors are vulnerable to a potential down cycle. (I wrote about one potential cycle The Long Term Debt Cycle). The US economy has had a good run, rents and property values have been rising for years, and while I don’t expect a market correction in the near future, I do think it is time for investors to look at their real estate exposure.
The main point is, you don’t need to foresee a crisis to change your real estate allocation. Compression of expected returns should be a good enough reason and that’s how I see it currently.
Commercial Real Estate (CRE) Fundamentals and Smaller Banks Exposure
Just like in other sectors, commercial real estate cap rates have dropped substantially since 2009, but still commercial real estate fundamentals look very reasonable. There are no large imbalances of supply or demand, banks have been much more conservative in their loan underwriting and economic growth, while not as strong, is still supportive and stable.
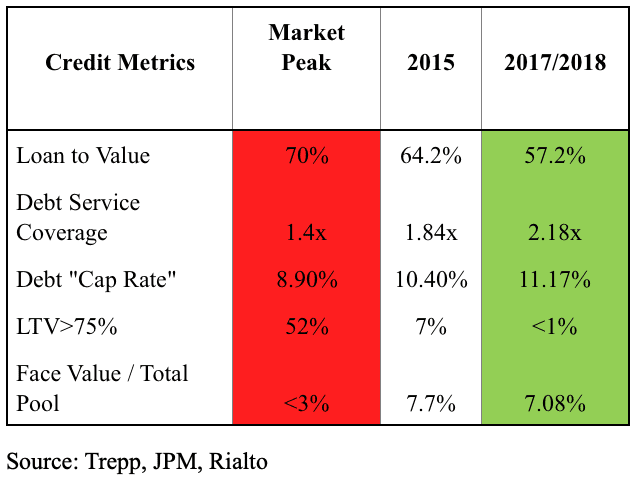
During the years leading up to the 2008 financial crisis it was common to see lenders originate mortgages at as high as 90 percent loan-to-value (LTV), but after the crisis, due to tighter regulations, banks have been reluctant to provide financing in excess of 60 percent LTV.
Tighter Regulatory Scrutiny
Despite higher loan origination standards, small and medium-sized banks didn’t reduce, and some increased their overall exposure to CRE loans. According to a July 2018 Milken Institute research report, many small and medium-sized banks have been increasing their exposure to CRE faster than they have been accumulating bank capital, causing their capital ratios to fall. “Small and medium-sized banks account for 62 percent of all CRE loans held by banks. Small banks alone account for 60 percent of nonresidential commercial loans of less than $1 million. Moreover, CRE lending makes up a large part of small banks’ balance sheets as a group, currently more than 30 percent, which is close to their crisis peak; and 24 percent of the balance sheets of medium-sized banks, exceeding their crisis peak.” Balance sheets of some medium-sized banks and smaller community banks are disproportionally exposed to CRE.
Delinquency Rates and High-Exposure Banks’ Market Share, 2005-2018- back to pre-crisis levels.
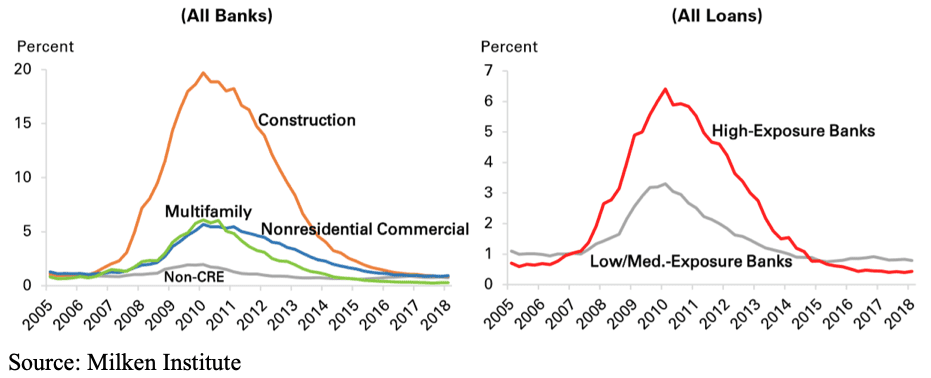
Putting it all together, low market caps, higher bank exposure to CRE loans and the longer than usual market cycle, increase the probability that in the next few years we will experience periods of volatility that would enforce small and medium-sized banks to reduce their exposure/liquidate loans to increase liquidity of their balance sheet.
Commercial Real Estate Debt
Owning properties directly or through funds entitles investors to rent income, but this income is subject to the uncertainty associated with rent, occupancy rate levels, capital improvement expenses and operating expenses that could make them more volatile and less predictable.
The findings I mentioned above, led me to do additional work on investment opportunities on the debt side, such as CMBS, high yield/distressed and direct lending.
I believe this is a good time for investors — especially real estate investors — to add or increase the allocation to senior commercial real estate debt. Adding commercial real estate debt to a real estate portfolio would increase diversification, lower the risk, potentially increase the returns and allow the investor to take advantage of future dislocation in markets.
One area of special interest to me is the CMBS market. This market is now the second largest source of capital for commercial and multifamily real estate lending. It provides liquid, viable and transparent funding for real estate borrowers and a wide array of global fixed income investors. It has helped fuel the growth and stability of the commercial real estate market by providing competitively priced loans for borrowers, while providing investors with potentially lower-risk investment opportunities at attractive yields.
Investing in lower rated senior loans secured by stabilized income producing properties, at a significant discount could generate risk-adjusted returns that compare favorably to holding the actual properties/equity, with debt risk characteristics and benefits.
CMBS has two main sources of returns. One is the interest rate paid on the debt and the second is capital gains through the purchase of bonds at a discount. For example, on average, a typical CMBS will have 93 percent investment grade bonds trading at ~Swap+105 basis points, 70 percent in AAA-rated bonds, 13 percent in AA-rated bonds, 5 percent in A-rated bonds and 5 percent in BBB-rated bonds. The remaining 7 percent are the “B” piece: BB, B and N/R bonds priced in absolute rates (as opposed to spreads over swap). Since the AAA bonds are sold at a premium to par, the issuer is able to sell the “B” piece at a significant discount and still generate a profit from the deal.
Not All Real Estate Debt Funds Are Created Equal
Here, more than many other investments, execution really counts. Managers must have the right capabilities. Building a diversified CMBS portfolio requires a robust infrastructure and specialty in not only investment management, but also property management which could lower risk substantially.
Disclosures
Omnia Family Wealth, LLC (“Omnia”), a multi-family office, is a registered investment advisor with the SEC. This commentary is provided for educational and informational purposes only. It does not take into account any investor’s particular investment objectives, strategies, tax status or investment horizon. No portion of any statement included herein is to be construed as a solicitation to the rendering of personalized investment advice nor an offer to buy or sell a security through this communication. Consult with an accountant or attorney regarding individual tax or legal advice.
Advisory services are only offered to clients or prospective clients where Omnia Family Wealth and its representatives are properly licensed or exempt from licensure. Information in this message is for the intended recipient[s] only. Please visit our website https://omniawealth.com for important disclosures.
This content is provided for informational purposes only, and is not intended as a recommendation to invest in any particular asset class or strategy or as a promise of future performance.. References to future returns are not promises or even estimates of actual returns a client portfolio may achieve.
The views expressed herein are the view of Omnia only through the date of this report and are subject to change based on market or other conditions. All information has been obtained from sources believed to be reliable but its accuracy is not guaranteed. Omnia has not conducted an independent verification of the information. The information herein may include inaccuracies or typographical errors. Due to various factors, including the inherent possibility of human or mechanical error, the accuracy, completeness, timeliness and correct sequencing of such information and the results obtained from its use are not guaranteed by Omnia. No representation, warranty, or undertaking, express or implied, is given as to the accuracy or completeness of the information or opinions contained in this report. This report is not an advertisement. It is being distributed for informational and discussion purposes only. Omnia shall not be responsible for investment decisions, damages, or other losses resulting from the use of the information. This report is not intended for public use or distribution. The information contained herein is confidential commercial or financial information, the disclosure of which would cause substantial competitive harm to you, Omnia, or the person or entity from whom the information was obtained, and may not be disclosed except as required by applicable law.
Statements that are non-factual in nature, including opinions, projections and estimates, assume certain economic conditions and industry developments and constitute only current opinions that are subject to change without notice. Further, all information, including opinions and facts expressed herein are current as of the date appearing in this report and is subject to change without notice. Unless otherwise indicated, dates indicated by the name of a month and a year are end of month.
Have Questions for An Advisor?
RELATED ARTICLES

Omnia Family Wealth Recognized as a Finalist for 2026 Family Wealth Report Awards
Read More
Omnia Family Wealth’s Michael Wagner Featured in MSN
Read More
Omnia Family Wealth’s Michael Wagner Featured on CNBC
Read More
Omnia Family Wealth’s Michael Wagner Featured in Barron’s
Read More
Omnia Family Wealth’s Lawrence Muscant Explores Geopolitical Forces Shaping Capital Markets
Read More
Grateful for Ten Years Together
Read More
Omnia Family Wealth Named to Financial Advisor Magazine’s 2025 Top RIA List
Read More