
Interest Rates, Real Rates and the Yield Curve: A Play Book for the Current Economic Cycle
BY ALON OZER AND LAWRENCE MUSCANT
Whether you’re investing in stocks, real estate, bonds or bond ETFs, it’s important to keep an eye on the bond market. The bond market serves as a reliable indicator of inflation and the overall economic trend. Understanding the difference between short- term and long-term interest rates, as well as the concept of the yield curve, can assist in making informed financial and investment choices.
Based on historical data, we know that economic downturns often follow similar sequences. Understanding and interpreting this data can help investors better mitigate risk and take advantage of investment opportunities. This sequence often follows this pattern:
1. The Federal Reserve will raise interest rates to slow down the economy and reduce inflation.
2. At some point, market conditions will become too tight, resulting in an inverted yield curve.
3. The yield curve will stay inverted for months to a few years, as we have seen in the past.
4. Short-term yields on the 2-year treasury will fall below the Fed funds rate, signaling tighter monetary conditions and advising the Fed to start lowering rates.
5. Economic indicators will indicate a clear slowdown, which is common during an inversion.
6. The yield curve will “suggest” a recession is approaching and steepen.
7. A recession occurs.
The chart below reflects the beginning of the sequence described above.
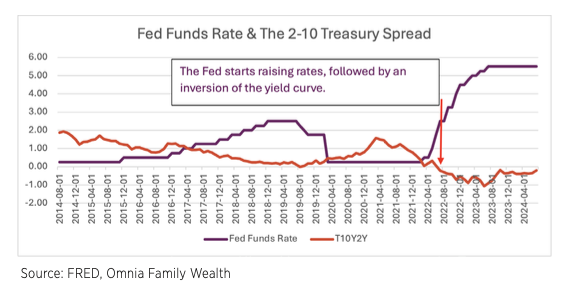
UNDERSTANDING THE YIELD CURVE
The treasury yield curve is a chart that shows the interest rates of bonds with different maturity dates. It is an important economic indicator with a significant history. Normally, the curve slopes upward, meaning that longer- term bond holders expect higher yields to make up for inflation and risk over time. Today, the yield curve is inverted, meaning the rates on short-term treasuries are higher than those with longer durations, indicating that investors expect a slowdown in economic growth and lower rates to follow.
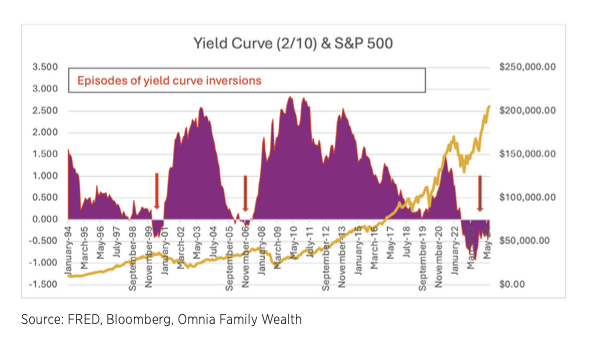
The most significant yield inversions occurred before recessions, such as in the late 1970s, early 1980s, 1990s, early 2000s and the Great Financial Crisis in 2007-2008. Each of these inversions preceded economic slowdowns or recessions by several months to over a year. For example, the inversion that began in 2006 signaled the looming financial crisis, which fully unfolded only in 2008.
The duration of each yield curve inversion episode varied depending on various economic conditions. Here are a few examples of important inversion episodes and their durations:
- Late 1978 to early 1980s saw an 18-month inverted yield curve, which led to the early 1980s recession due to high inflation and tight monetary policy.¹
- From late 1988 to early 1990, the yield curve was inverted for about 11 months. This inversion happened before the 1990-1991 recession, because of the Federal Reserve’s actions to counter inflation and the subsequent economic slowdown.¹
- During the mid-2000s, the yield curve was inverted for approximately 10 months, signaling the onset of the 2001 recession, which was exacerbated by the dot-com bubble burst and the 9/11 terrorist attacks.¹
- From late 2006 to mid-2007, the yield curve was inverted for around 10 months. This inversion began in December 2006 and continued until mid-2007, preceding the 2008 financial crisis and the subsequent Great Recession.¹
The chart below illustrates three yield curve inversions followed by a downturn in the S&P 500. The time gap between the yield curve inversion and a stock market downturn can vary significantly, so it is not advisable to use it as a market timing tool. However, it does indicate that something significant is occurring in the market.
INTEREST RATES ARE A LAGGING INDICATOR
The Federal Reserve’s adjustment of interest rates often doesn’t immediately impact the economy. Changes in consumer behavior and business decisions occur gradually as borrowing costs gradually affect spending, investment, and saving. It may take months for higher interest rates to affect mortgage payments, credit card interest and business decisions regarding investment, hiring or expansion.
The lag, also known as the “transmission mechanism,” refers to the time it takes for the full effects of a rate change to show in the economy, which can range from six months to two years. This delayed impact makes monetary policy challenging, as central banks need to forecast future economic conditions and adjust rates accordingly.
The current economic cycle is experiencing a longer delay – the longest on record – due to significant accommodation and stimulus from the Fed and government in response to the COVID pandemic. Since the end of 2019, household financial assets grew by $29 trillion to $123 trillion, a 31% increase, while non-financial assets grew by $19 trillion to $59 trillion, a 48% increase during the same time period.² This resulted in households’ wealth growing 12 times more than their liabilities!
Despite the current inversion of the yield curve, it may take a significant amount of time for any potential recession to materialize. The system still holds a considerable amount of liquidity, which could explain why the economy continues to grow, many businesses are still profitable, and the equity market is on the rise.
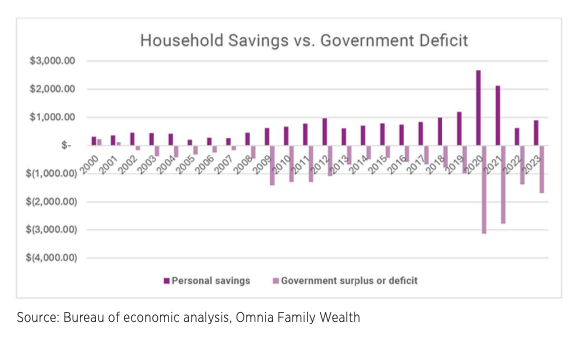
In the chart above, we can observe a significant increase in the government budget deficit in response to the COVID pandemic, which is directly attributed to abnormal household savings.
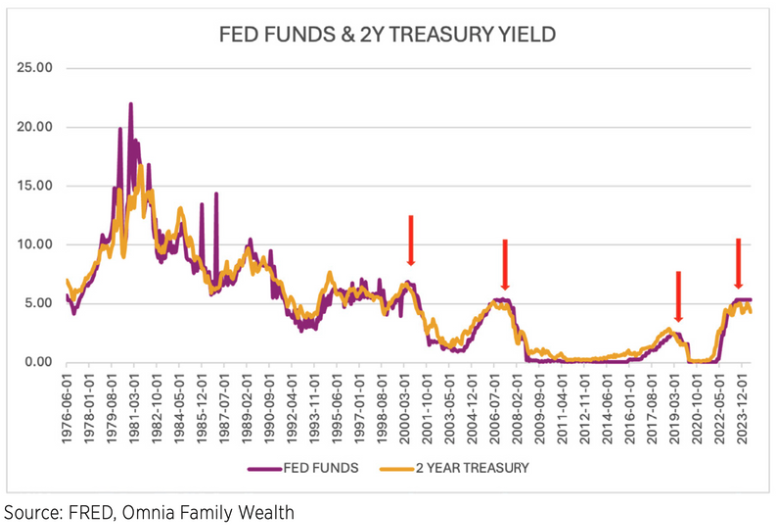
THE 2-YEAR TREASURY YIELD AS AN INDICATOR OF MONETARY CONDITIONS
The assessment of monetary conditions involves the use of various methods and tools. An important indicator is the 2-year treasury yield. When the 2-year yield is higher than the Fed funds rate, it suggests loose monetary conditions. Conversely, when it’s lower, it indicates tight monetary conditions. The 2-year yield often drops below the Fed funds rate after the Fed stops raising rates, as higher rates slow down the economy. However, it’s essential to consider this indicator alongside others to understand the reasons for the yield diverging from the Fed funds rate.
Based on the chart below, it is evident that whenever the yield on the 2-year treasury fell below the Fed funds rate, a faster economic slowdown ensued, prompting the Fed to lower rates in response.
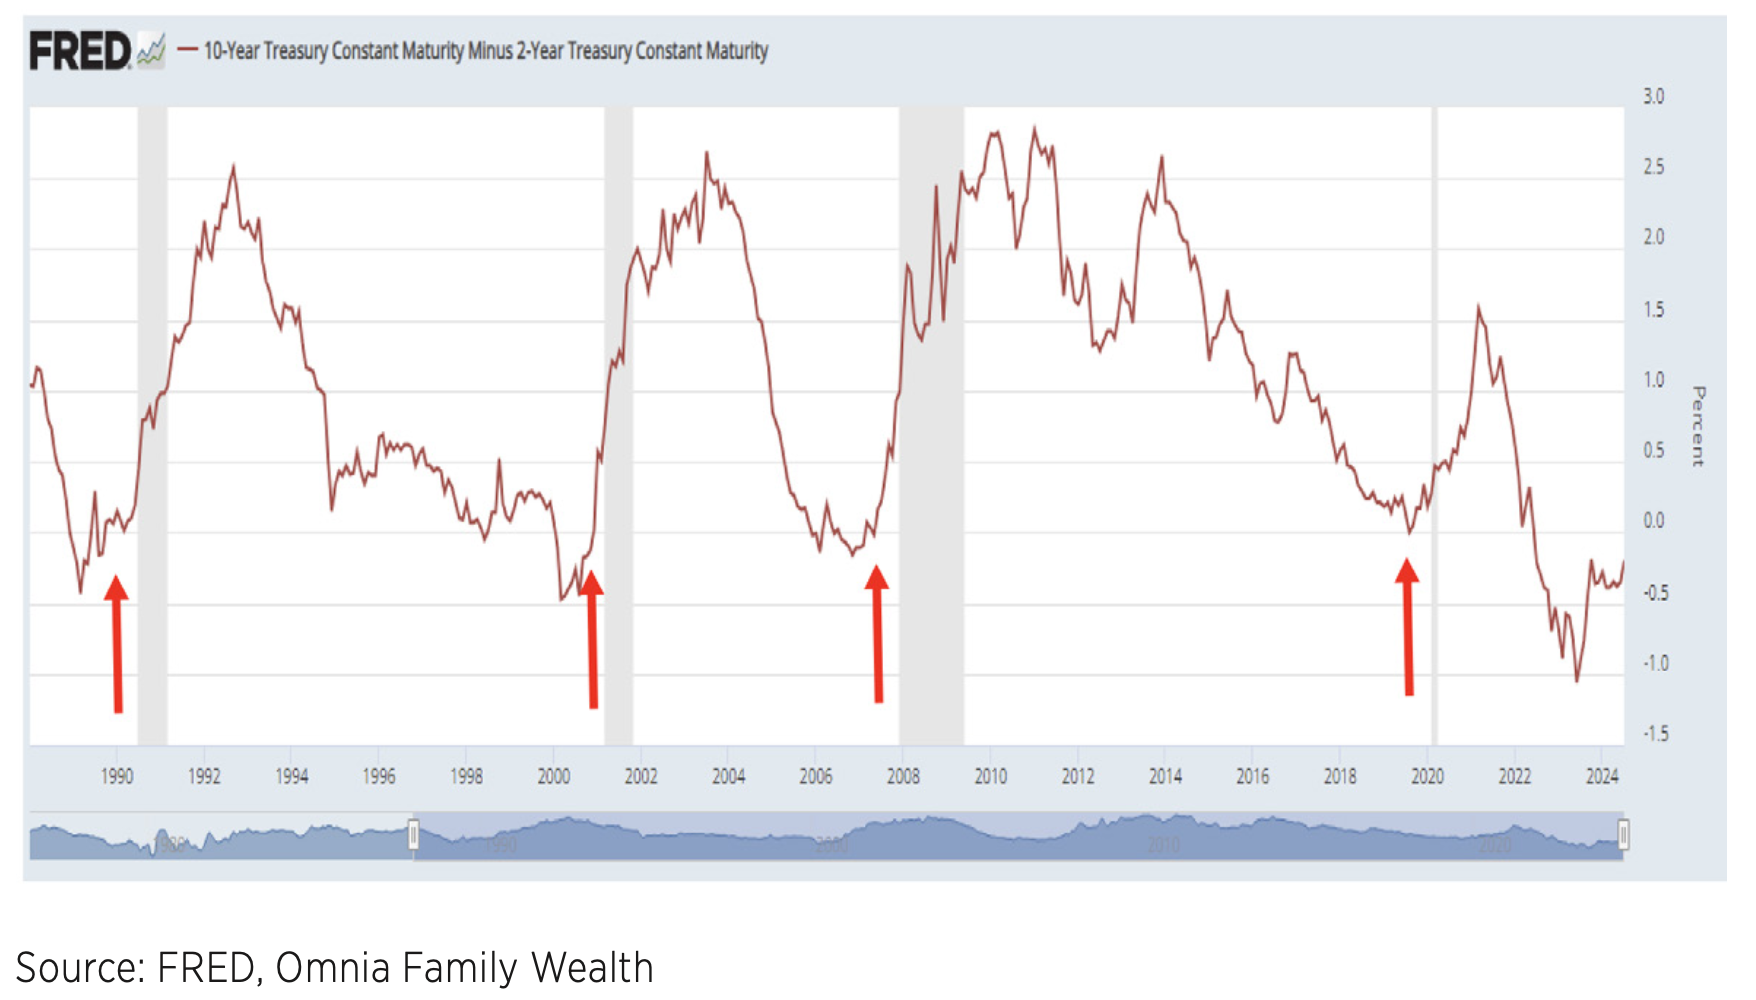
IS THE YIELD CURVE STEEPENING?
The last indicator before a recession is officially declared, and just before the equity markets react negatively, is called a “bull steepening” of the yield curve. This occurs when short- term interest rates fall faster than long-term interest rates, creating a steeper yield curve. This typically happens when central banks are cutting rates to stimulate the economy and prevent a recession in a declining interest rate environment.
The chart below illustrates four examples of the yield curve steepening after an inversion, occurring right before a recession (gray areas on the chart).
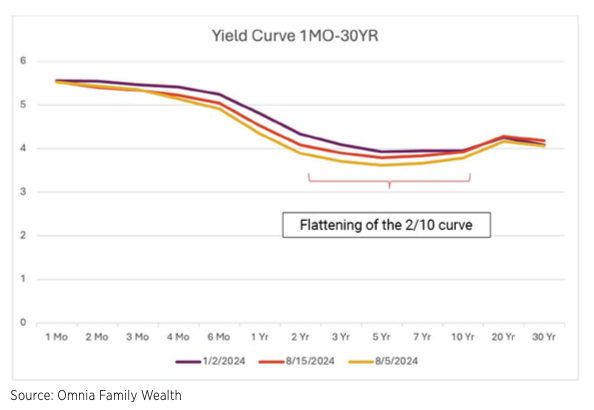
After the release of the recent jobs report, the bond market experienced a significant shift, leading to expectations of five interest rate cuts in the next three Fed meetings. Yields began falling in early July, particularly after July 11th when the Core CPI for June was released, showing strong disinflationary pressures and an unusual downward rate of change.
For context, as we entered the 2001 recession, the Fed’s initial three rate cuts were 50+50+50. Similarly, heading into the 2008 financial crisis, the Fed’s first three rate cuts were 50+25+25.
However, the yield curve has not yet returned to a normal state; it has only flattened, as seen in the chart below. The curve typically normalizes (becomes steeper) only when there are clear signs that the economy is slowing, and a recession is likely.
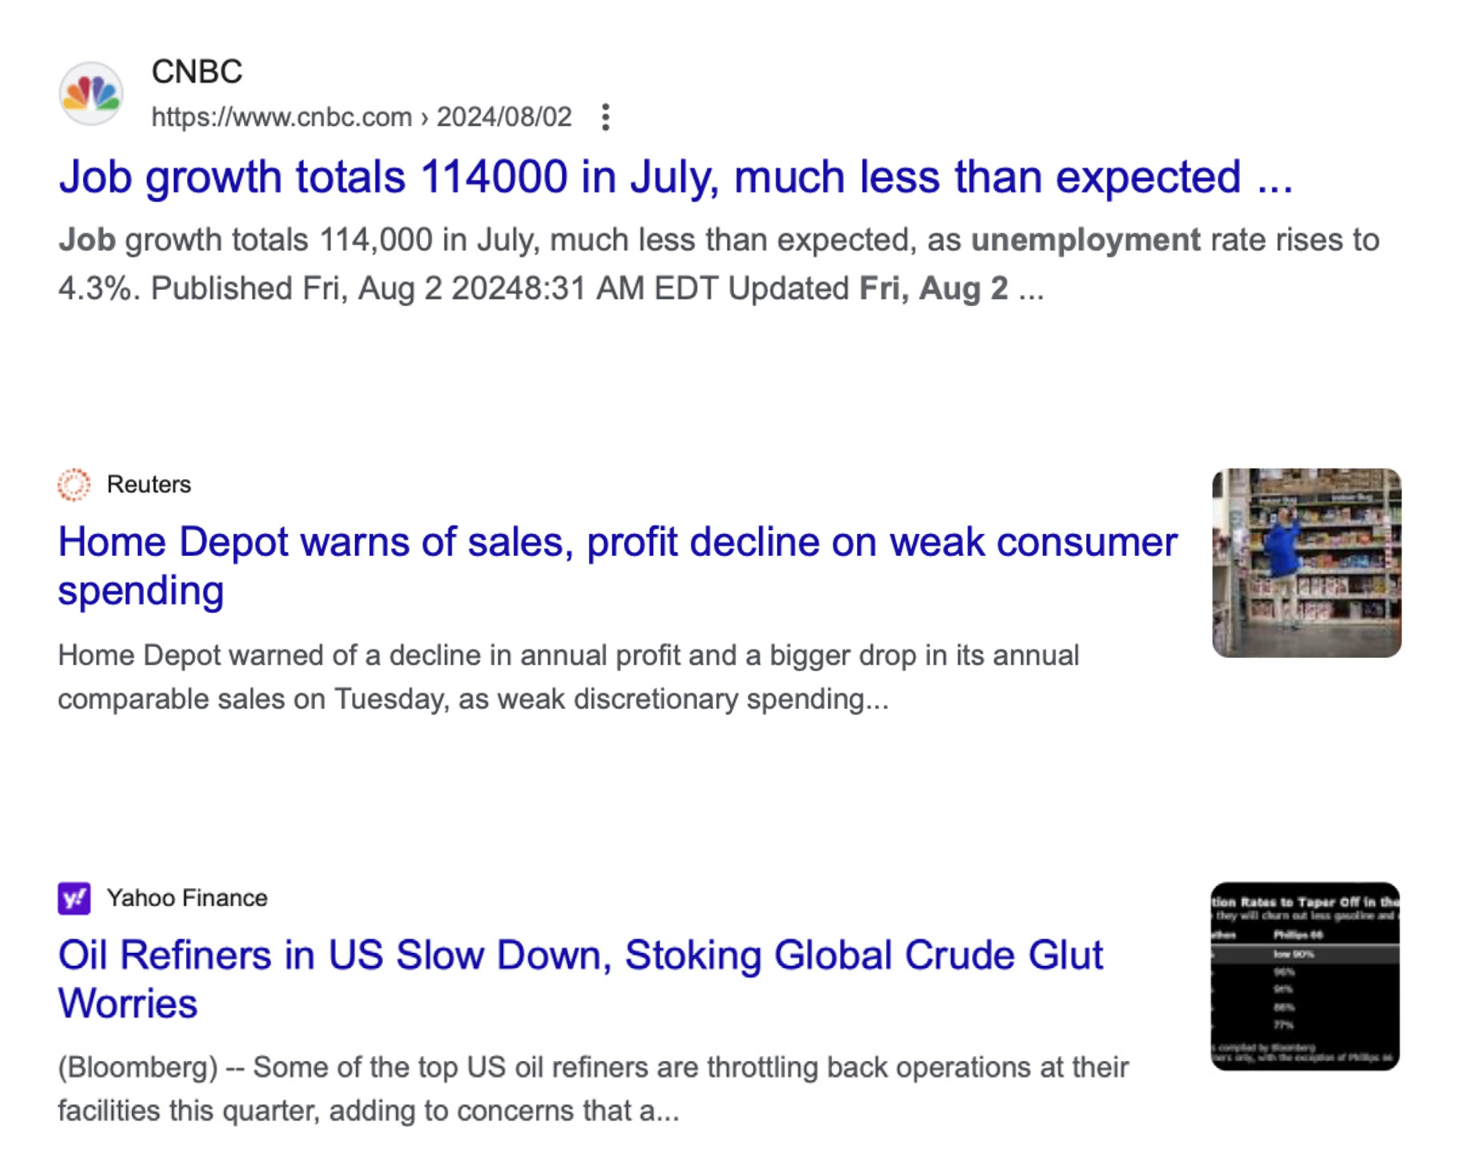
Recent slowdown signals:
THE IMPORTANCE OF REAL RATES
Investors should pay attention to real interest rates, which account for inflation. Unlike nominal rates set by the federal reserve, real rates signify the true cost of borrowing and the actual return on investments. While the Fed funds rate influences short-term economic activity, real rates determine the purchasing power of money over time. They directly affect consumer spending and business investment decisions by impacting the cost of money and asset yields. Low or negative real rates encourage borrowing and spending, driving economic growth. Conversely, high real rates can suppress economic activity by increasing borrowing costs and making saving more appealing. Therefore, real rates serve as a more precise indicator of the economic environment and have a direct impact on economic behavior and long-term growth prospects.
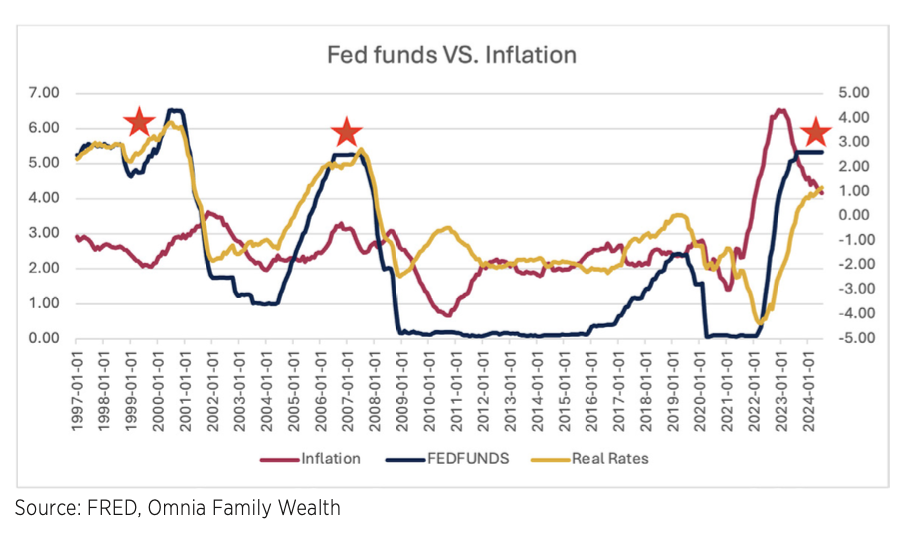
When the Fed funds rate is higher than the inflation rate, it can have a restrictive effect on the economy. In this situation, real interest rates are positive, and the cost of borrowing is higher in real terms. As a result, consumers and businesses may reduce spending and investment because loans and credit become more expensive. Additionally, higher borrowing costs can lead to slower economic growth, as businesses may delay or cancel expansion plans, and consumers may cut back on major purchases such as homes and cars.
If we look at today’s interest rates from a historical perspective, they are significantly higher than real rates. This is probably the main reason we are starting to see more evidence of a slowing economy. The longer real rates remain higher than the Fed funds rate, the more things will begin to break.
CONCLUSION
In summary, the current environment does not suggest an imminent recession. At the same time, the treasury market still offers valuable insights that investors should pay attention to. This includes understanding the relationship between various durations and yields in relation to important economic indicators. Having a roadmap supported by historical events, such as those described in this memo, is crucial for investors to gain a better understanding of our current position in the economic cycle. This knowledge empowers them to mitigate risks and seize opportunities.
IMPORTANT INFORMATION
Omnia Family Wealth, LLC (“Omnia”), a multi-family office, is a registered investment advisor with the SEC. This commentary is provided for educational and informational purposes only. It does not take into account any investor’s particular investment objectives, strategies, tax status, or investment horizon. No portion of any statement included herein is to be construed as a solicitation to the rendering of personalized investment advice nor an offer to buy or sell a security through this communication. Consult with an accountant or attorney regarding individual tax or legal advice.
Advisory services are only offered to clients or prospective clients where Omnia Family Wealth and its representatives are properly licensed or exempt from licensure. Information in this message is for the intended recipient[s] only. Please visit our website https://omniawealth.com for important disclosures.
This content is provided for informational purposes only and is not intended as a recommendation to invest in any particular asset class or strategy or as a promise of future performance. References to future returns are not promises or even estimates of actual returns a client portfolio may achieve.
The views expressed in this commentary are subject to change based on market and other conditions. These documents may contain certain statements that may be deemed forward looking statements. Please note that any such statements are not guarantees of any future performance and actual results or developments may differ materially from those projected. Any projections, market outlooks, or estimates are based upon certain assumptions and should not be construed as indicative of actual events that will occur.
All information has been obtained from sources believed to be reliable, but its accuracy is not guaranteed. There is no representation or warranty as to the current accuracy, reliability or completeness of, nor liability for, decisions based on such information and it should not be relied on as such.
For current Omnia Family Wealth information, please visit the Investment Adviser Public Disclosure website at www.adviserinfo.sec.gov
¹Source: FRED
²Source: Bureau of Economic Analysis
Have Questions for An Advisor?
RELATED ARTICLES
THE CATCH-22 OF INVESTING IN ARTIFICIAL INTELLIGENCE
Read More
PRIVATE CREDIT: DATA, DISCIPLINE, AND DIVERSIFICATION
Read More
IT’S TIME FOR HEALTH CARE TO PUT BRAIN HEALTH FRONT AND CENTER
Read More
PRIVATE CREDIT: OPPORTUNITY AND THE CRITICAL ROLE OF MANAGER SELECTION
Read More
BEYOND THE HEADLINES: HOW GEOPOLITICS MOVES MARKETS
Read More
TRUMP’S TARIFF STRATEGY: A Comprehensive Overview
Read More
The Exit Trap: Avoiding the Illusion of Forever Wealth
Read More