Competing for Liquidity: Financial Markets vs. the Treasury Department
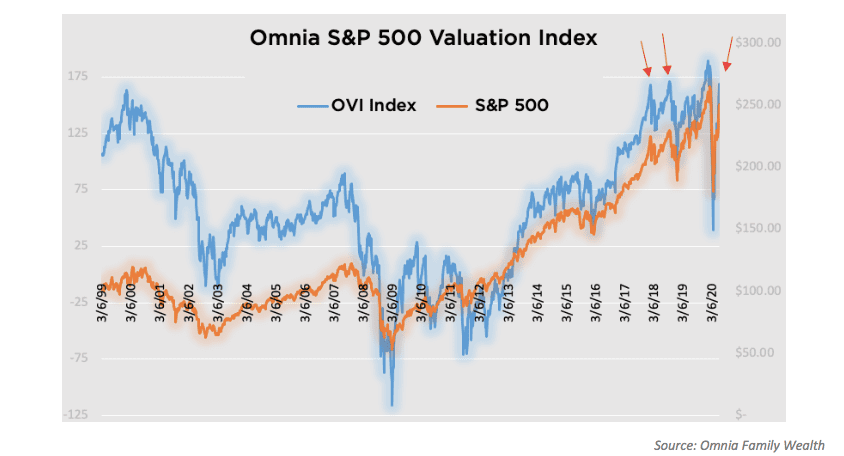
The US equity markets are roaring higher, against most, if not all, analysts’ and economists’ projections. Yes, we agree that there is a disconnect between the fundamentals and valuations, or between the real economy and financial markets. Below is our valuation model you have seen many times. Valuation levels as of June 8, 2020, are at the levels they were before two large market corrections in January 2018, and September 2018. In January 2020, these levels broke higher with the help of the Fed but didn’t get too far before falling again. The model is not a crystal ball, but it tells us that investors are paying very high prices for the earnings companies are providing… high risk with zero expected returns. But we have to remember, the market doesn’t really care what we, or other people, think about valuations. That’s why we do not attempt to time the markets.
If you ask investors, professionals or not, most of them have the same answer to the market rally. The Fed has printed trillions of dollars, so the massive liquidity supports and pushes equities higher. We also know the Fed has purchased about $1.3 billion in ETFs , mostly corporate bond ETFs. But is it really the reason?
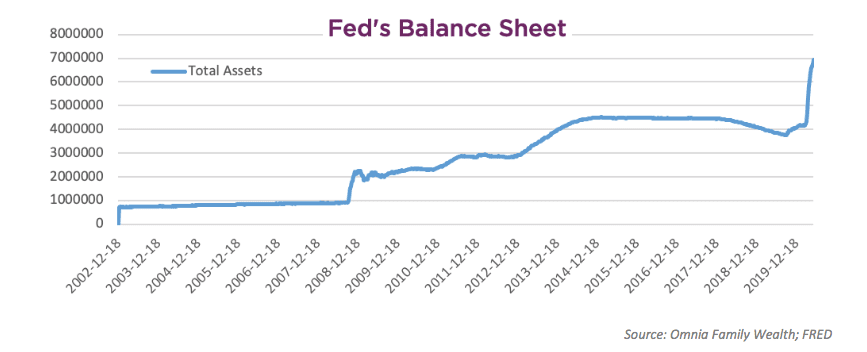
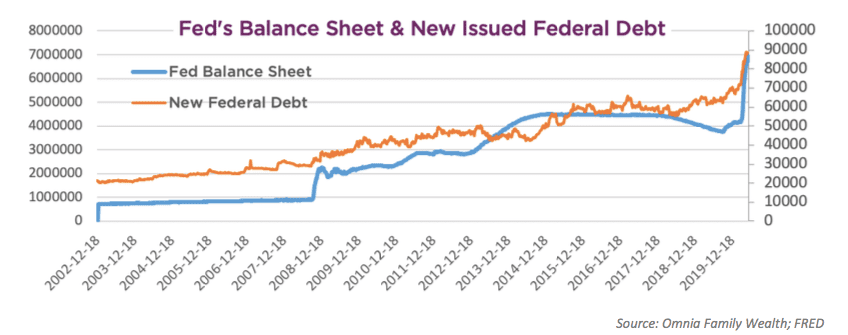
The chart below shows the size of the Fed’s balance sheet. As you can see, since March of this year, the Fed’s balance sheet has grown by more than $3 trillion. Now that’s a massive liquidity injection!
But the Fed has two very large mouths to feed: the financial market and the US Treasury. As you can see from the next chart, since the beginning of the crisis, the US Treasury has increased its debt issuance dramatically (orange line), and they plan to issue much more. The Fed is buying the majority of the debt and basically funding the government and the fiscal policy to support individuals and the economy. So, as the government needs to raise more debt, the Fed will need to print more dollars to purchase the debt.
The net result is that the liquidity in markets is significantly lower than what is perceived. In the chart below we subtracted the weekly growth in the Fed’s balance sheet (or new money printed) by the new debt issued by the Treasury. As you can see, liquidity is actually flattening.
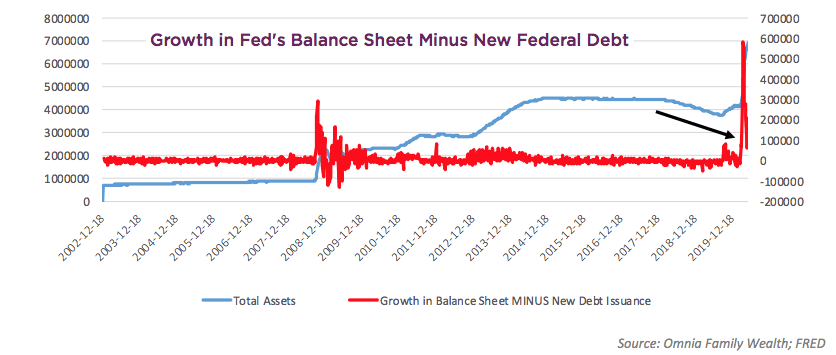
The immense issuance of new debt by the government is “sucking” dollars and liquidity out of the world economy that is starving for dollars. If debt issuance grows higher than Fed purchases of the debt, we could see a higher dollar, which is very bad for risk assets.
We’re not surprised. This is all part of the long-term debt cycle we wrote about in 2018. There’s no going back for the Fed. The Fed is stuck in a vicious cycle. They must keep buying US treasuries to fund (monetize) the US government debt, and its stimulus programs. That is causing upward pressure on long-term rates, but because we can’t afford higher rates, the Fed will keep buying treasuries to keep rates lower. This is what we call curve control. The most important shifts in markets take years to develop, but unless you have a continual process to identify and prepare for them in advance, when they occur it’s sometimes too late.
Click here to download the article.
Important Information
Omnia Family Wealth, LLC (“Omnia”), a multi-family office, is a registered investment advisor with the SEC. This commentary is provided for educational and informational purposes only. It does not take into account any investor’s particular investment objectives, strategies, tax status, or investment horizon. No portion of any statement included herein is to be construed as a solicitation to the rendering of personalized investment advice nor an offer to buy or sell a security through this communication. Consult with an accountant or attorney regarding individual tax or legal advice.
Advisory services are only offered to clients or prospective clients where Omnia Family Wealth and its representatives are properly licensed or exempt from licensure. Information in this message is for the intended recipient[s] only. Please visit our website https://omniawealth.com for important disclosures.
This content is provided for informational purposes only and is not intended as a recommendation to invest in any particular asset class or strategy or as a promise of future performance. References to future returns are not promises or even estimates of actual returns a client portfolio may achieve.
The views expressed herein are the view of Omnia only through the date of this report and are subject to change based on market or other conditions. All information has been obtained from sources believed to be reliable, but its accuracy is not guaranteed. Omnia has not conducted an independent verification of the data. The information herein may include inaccuracies or typographical errors. Due to various factors, including the inherent possibility of human or mechanical error, the accuracy, completeness, timeliness and correct sequencing of such information and the results obtained from its use are not guaranteed by Omnia. No representation, warranty, or undertaking, express or implied, is given as to the accuracy or completeness of the information or opinions contained in this report. This report is not an advertisement. It is being distributed for informational and discussion purposes only. Omnia shall not be responsible for investment decisions, damages, or other losses resulting from the use of the information. This report is not intended for public use or distribution. The information contained herein is confidential commercial or financial information, the disclosure of which would cause substantial competitive harm to you, Omnia, or the person or entity from whom the information was obtained, and may not be disclosed except as required by applicable law.
Statements that are non-factual in nature, including opinions, projections, and estimates, assume certain economic conditions and industry developments and constitute only current opinions that are subject to change without notice. Further, all information, including opinions and facts expressed herein are current as of the date appearing in this report and is subject to change without notice. Unless otherwise indicated, dates indicated by the name of a month and a year are the end of the month.


