

Omnia Observations: What should we do with this “partial” yield curve inversion?
Last week we saw the yield on the three-year treasury note moving higher than the yield on the five-year treasury note. I read many interpretations on this partial inversion and no doubt investors are anxious. The recent sharp drop in equity markets obviously doesn’t help investors’ confidence. The reason so many investors are such careful observers of the yield curve is that it is actually one of the most reliable indicators of an upcoming economic slowdown. But what is the meaning of a partial inversion? How should investors read a partial inversion?
We know that rising short-term borrowing costs put pressure on consumers and companies, and the pressure is probably higher in the current highly leveraged economy. But, looking historically at partial inversions of the yield curve, we find that there’s no direct correlation between a partial inversion and an upcoming recession. In fact, historically, after a partial inversion of the yield curve, equity markets saw mostly positive returns, and sometimes for a while before the economy fell into a recession.
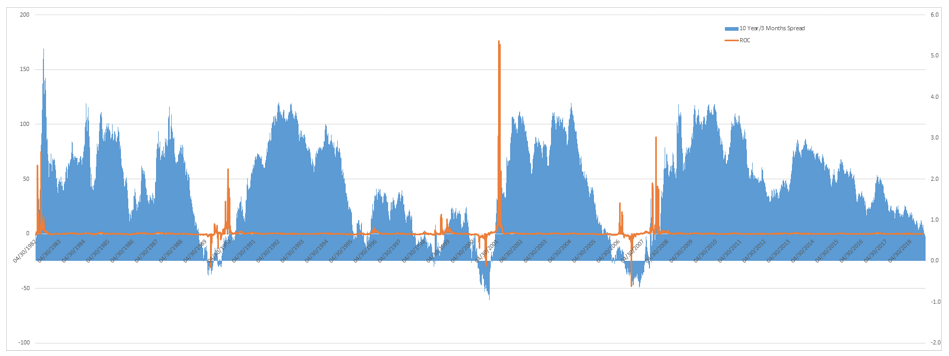
But a partial inversion does tell us something. In the last 50 years, very consistently, once the yield on the three-year treasury note exceeded the yield on the five-year treasury note, a full inversion followed. A full inversion means the yield on 3-month treasury bill is higher than the 10 year treasury note. Once a full inversion occurs, there’s a high probability the economy will fall into a recession within the next 10 months on average. All of the last seven recessions were predicted by a full inversion of the yield curve.
The “timing” of the inversion is important as well. Especially when it coincides with extreme levels in other indicators such as equity market valuations, unemployment levels, wealth-to-income ratio, and where the Fed is in interest rate direction. Together, they can better point to where we are in the economic cycle.
What should investors watch for once the yield curve fully inverts?
While no indicator is 100% error-proof, once the yield curve fully inverts, investors should assume a potential economic slowdown is approaching.
Then, the next indicator to watch for once the yield curve fully inverts is a steepening of the curve! As illustrated by the orange line on the chart below, historically, once the curve steepens back after a full inversion, it was not long before equity markets suffered significant losses.
Have Questions for An Advisor?
RELATED ARTICLES

BEYOND THE HEADLINES: HOW GEOPOLITICS MOVES MARKETS
Read More
TRUMP’S TARIFF STRATEGY: A Comprehensive Overview
Read More
The Exit Trap: Avoiding the Illusion of Forever Wealth
Read More
AI: Key Insights for Investors
Read More
Interest Rates, Real Rates and the Yield Curve: A Play Book for the Current Economic Cycle
Read More
Monetary Shenanigans: Credit, Collateral and the Banking System
Read More
Rising Interest Rates & Tightened Lending: Understanding The Effects Of The Fed’s Fight Against Inflation
Read More