Q2 2022 Ended. It’s Again Time for Us to NOT Share Our Quarterly Outlook
The first half of 2022 is behind us, and it is that time again when many investment firms release their “outlook” and “projections” for the rest of the year and beyond. Most quarterly letters we see discuss whether the US is heading into a recession, if and when the Fed stops raising rates, will inflation ease, by how much, and so on. We don’t.
Many investors and advisors will undoubtedly remember the first two quarters of 2022 for a long time. Equity markets turned negative early in the year, and at some point, the S&P500 was down over 20%, and the Nasdaq down over 30%. Bonds had their largest drawdown since 1994. Many tech darlings of last year got decimated, and crypto coins and companies disappeared.
While the timing of these events was not predictable, their probability grew significantly in 2021, as we wrote about in our commentary, It’s Never A Bad Time To Be Prepared. Especially Today. But clients do not hire us to tell them what happened in the past year or quarter; they are paying us to think and prepare for what the future might look like and how it could affect their wealth.
Recession or No Recession?
There’s much chatter in the financial media about whether the U.S. economy is already in a recession or if and when it will be. And just like many other things in our society today, there’s a debate (especially among politicians) about the actual definition of a recession.
But I believe the question of whether the US economy is or will be in a recession next year is irrelevant for investors. The technical definition of a recession tells us absolutely nothing about the expected returns of assets or what markets will do. In fact, many times, by the time economists officially declare a recession, the markets have bottomed or were close to bottoming. Markets have also recovered before a recession was technically over. Take, for example, the chart below from Doubleline. The average drawdown in the S&P 500 during a recession since 1948 is -29.9%. So how is that helpful information when the lowest drawdown is just -13.9% and the largest is -56.8%? Remember the man who drowned in a river with an average depth of 3 feet.
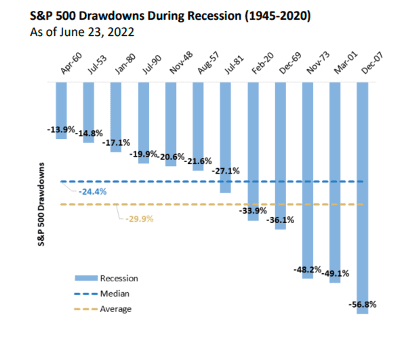
Source: Doubleline Macro Asset Allocation Team, June 2022.
It is one thing to estimate the probability of an event happening (like a recession, for example), but without understanding the potential magnitude of the event, the information is either useless or unusable.
In Today’s Environment, Events Are Faster and Greater in Magnitude
If the work of predicting the next economic environment isn’t hard enough (we think it’s just not possible or repeatable), the pace of the change has grown materially in the last decade.
In our memo Navigating An Uncertain Future, we gave an example of the fast shifts between economic environments. Starting in 2018, we have witnessed markets moving fast and strong between the four quadrants below. Remember, markets do not wait for any economic environment to be declared by economists or politicians; they price events way ahead of the expected event. Sometimes they are right, sometimes they are wrong, but the speed and magnitude of these shifts are unpredictable. The only way to protect and benefit from these changes is by having a well-balanced portfolio between the four main environments.
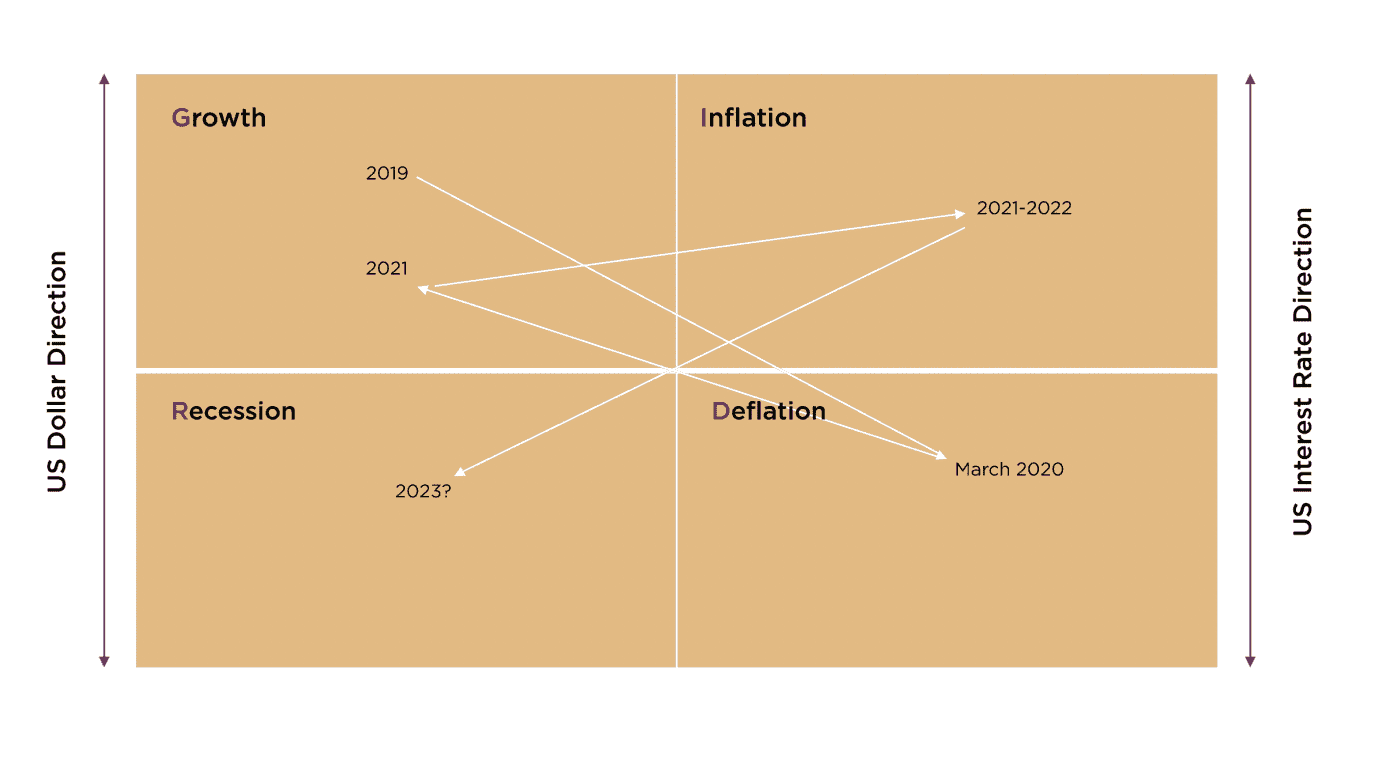 Source: Omnia Family Wealth
It’s helpful for investors to understand that most important events in financial markets are unpredictable, and the ones that are predictable are just not important.
Markets Connected by A Broken Monetary System
The most important negative consequence of the global financial crisis is that world economies have become linked together by the monetary system. This means that a change in liquidity in one market will also affect other markets. This makes the task of global portfolio diversification much harder. For example, we can look at the 2017 synchronized growth or the synchronized global slowdown in 2011 and 2015. We can also look at the 1991 and 2001 recessions prior to the GFC, which were relatively mild since they were only in the US. There are no individual economies anymore (until the problem is fixed), but instead, we have a world financial system, which increases the risks of major financial disorder. Our asset allocation methodology aims to minimize these risks while not giving up on expected returns.
How large can the adjustment be?
The equity market’s major indices corrected a bit (currently S&P500 -13% YTD), and many individual stocks are down much more. But overall sentiment, leverage and valuations didn’t move much.
Households
The U.S. household wealth-to-income ratio hit 820% in Q1 2022. In Q1 2007, it was at 670%. The long-term ratio is 550%. Just going back to its historical average, we would see a massive drop in value and purchasing power destruction (Fed’s Financial Accounts of the US, Q1 2022).
Valuations
Currently, the S&P 500 trades at around 29 times its Shiller 10-year CAPE ratio, compared to the average of 21 times over the past 50 years. In addition, market cap for the Wilshire 5000 is around 158% of U.S. GDP, that’s compared to 141% during the 1999-2000 tech bubble.
Corporate earnings
If margins only fall back to their 10-year average, profits for S&P 500 companies would decline by 25% compared to their 2021 levels. During the recessions of 2001-2002 and 2008-2009, earnings per share of the S&P 500 fell 25% and 50%, respectively. Stock prices followed, with the S&P 500 falling 49% from its peak during March 2000-October 2002 and 57% from its peak between October 2007-March 2009.
Analysts’ earnings estimate
While equity markets are correcting, mortgage applications are dropping hard and fast, and consumer sentiment is at an all-time low, analysts didn’t change their earnings outlook for next year (see chart). To me, it seems the market has only priced in the higher rates-lower multiples, but not lower earnings. (Read more: Bull Market Never Ended for Analysts Wedded to 100% Price Rally Calls)

For the last decade and especially the last two years, prices of financial assets rose dramatically. Quantitative easing created strong demand for financial assets. The real economy, on the other hand, didn’t experience strong growth or even close (until the fiscal stimulus was launched). Now, because financial asset prices are simply future claims on cash flow and earnings from the real economy, we have a large mismatch, and with the demand side (monetary stimulus and QE) gone and the economy slowing materially, the gap could close fast.
How Do Investors Interpret the Inverted Yield Curve?
The treasury yield curve is the most inverted it has been since 2000. The U.S. 2-year Treasuries are yielding the most vs. the 10-year notes since 2000. Usually, investors will look at this as a signal of recession in the following 12-18 months. This time, investors are interpreting this differently. The curve is inverted because the Fed will be successful in fighting inflation, so they could stop raising rates and lowering rates again down the road.
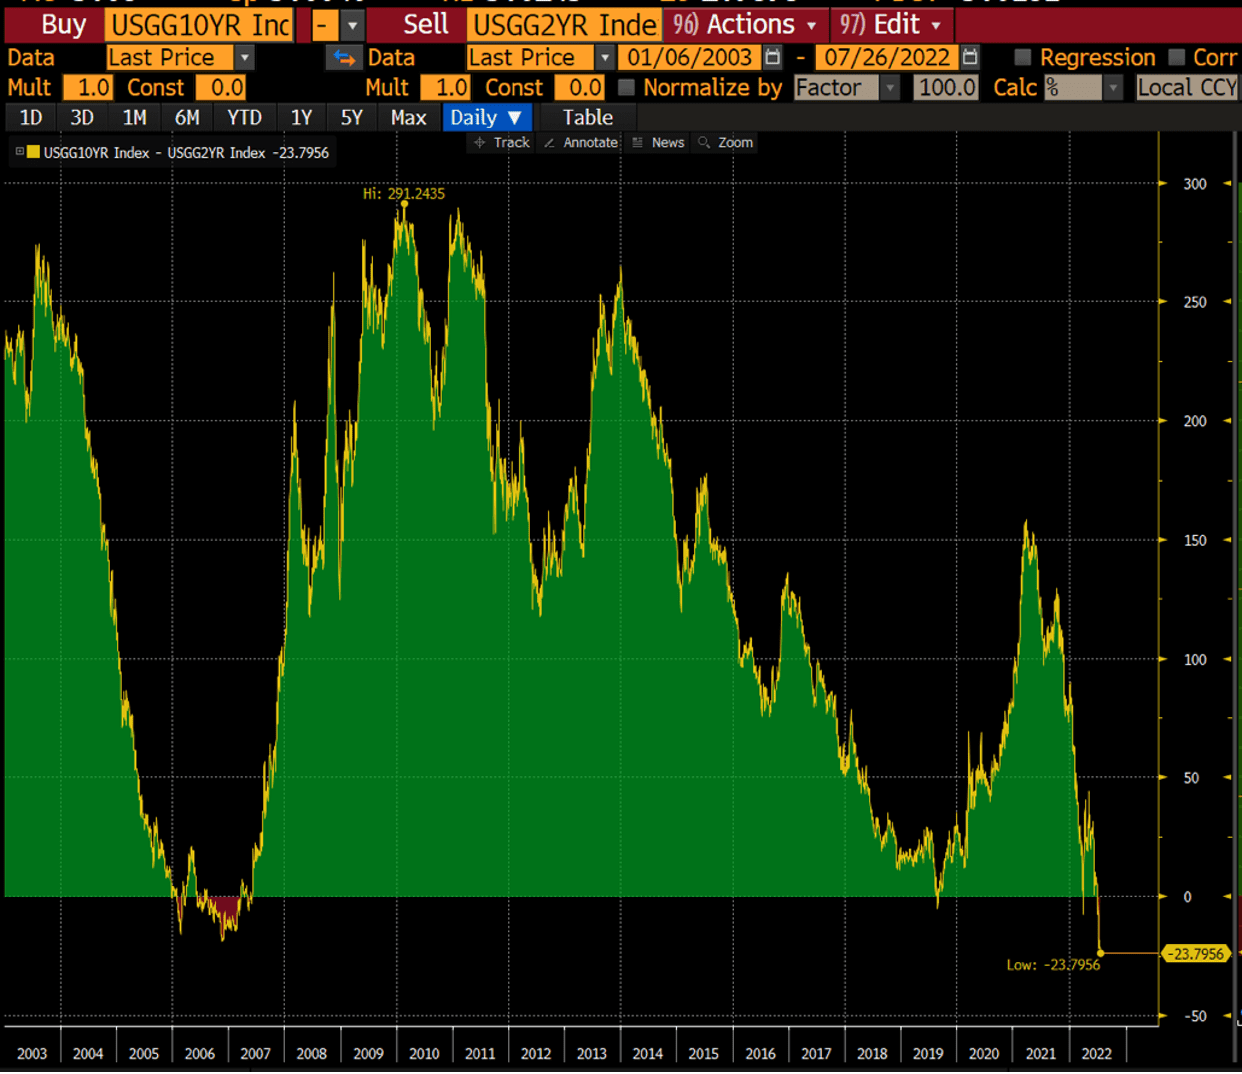
Source: Bloomberg
We see the same in the Eurodollar futures curve. The curve is invested, and investors are focusing on the cup half full. Lower interest rates. (Read more: Eurodollar futures market betting a hawkish Fed could ease rates slightly in 2024.)

Source: Reuters
I’m not saying that investors are wrong regarding future interest rates. In fact, the Fed cut rates before inflation peaked in 1974, 1989 and 2008. I do think, though, that investors are missing the big picture and the most important question. What does it mean for the economy? How bad must things be for the Fed to start lowering rates from the point of record inflation? Is the curve pricing in a large-negative event for the economy?
It is no secret that credit growth was and is the main driver of U.S. economic growth. This makes the economy much more sensitive to higher interest rates. So, the more important question is if and how the economy can handle positive real rates at 370% DEBT to GDP. Is that what the curve is pricing?
 ‘
‘
Source: FRED
Summary
What we do not know is much more important than what we do know or what we think we know. What is priced in markets today will have a minor effect if it is correct but a large effect if it is wrong. Investors are asking the wrong questions and focusing on minor potential events. The main risk with inflation isn’t higher prices; it’s the inability of the Fed to save investors if markets fall hard. The main risk with higher interest rates today isn’t a slowing economy; it’s the implications of not being able to handle positive real rates and the strengthening of the dollar that can break world economies.
The intervention of the Fed in markets in the last two decades brought investors to believe that risk is volatility, meaning, as long as you can hang on to your positions, take the volatility and take advantage of the buying opportunity, you will always come ahead as markets always bounce back. But risks today are different and are not priced in markets. The real risk today is the potential permanent loss of capital in many assets and strategies. This is not another short debt cycle but a potential secular regime change. We can’t predict, but we can focus on the important events. If I’m wrong, markets and portfolios will do well. If I’m right, markets will suffer, but portfolios will be protected.

