
Reading the Yield Curves
We wrote a lot about the bond market in the last year, so the recent action in treasuries is not a surprise to us or our clients. It is all part of the overall picture we see.
The US treasury market has more depth and liquidity than any other market in the world, and the information it provides is very valuable. The information reflected in the curve is extremely important especially today, at a time of the biggest global monetary experiment in history when no one really knows what the outcome will be.
I often talk about the insight the yield curve can provide us and not only when it is steep or inverted.
The common interpretation of the curve is that when it is steepening, inflation pressures are rising, and economic growth should increase. When the yield curve is inverting the expectation is that the economy is slowing and could fall into a recession in the short term. But there’s so much more information imbedded in the curve.
Different durations on the curve mean different things and looking at how they behave independently and then in relation to each other can tell us a lot about the condition of the economy and monetary policy. It’s also important to look at the way a curve got to its current shape.
The two durations I like to use are the 5y-10y, “the long curve” and the 3m-5y, “the short curve.” The short curve is a reflection of current monetary policy while the long curve reflects the market’s view on future inflation and economic growth, and in a sense, it is a barometer for the Fed’s policy.
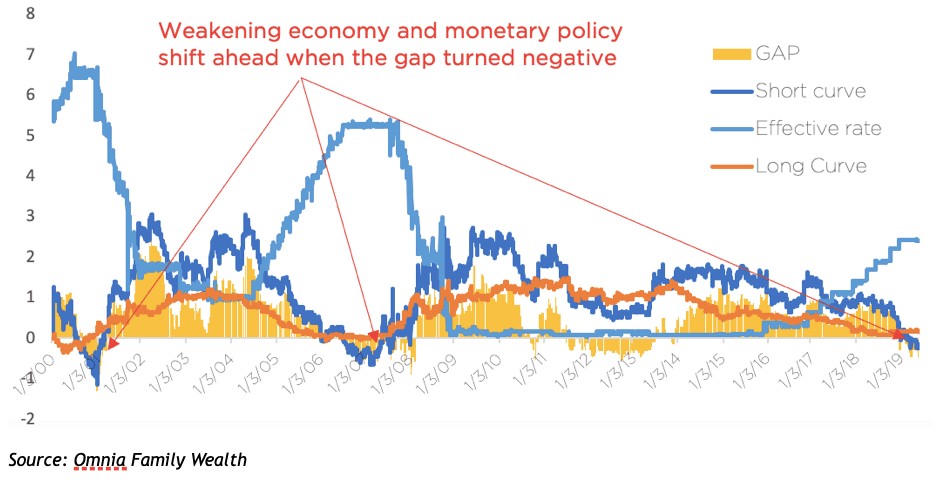
One use of the two curves is projecting a weakening economy and monetary policy shift. In the chart/model we built below you can clearly see that every time before the economy (and equity markets) got into trouble, the short curve inverted and crossed the long curve (the yellow gap), even when the yield curve as a whole was NOT inverted or even flat. In addition, every time this happened, the Fed intervened either by lowering interest rates or purchasing treasuries in the open market (as it did in 2012 and 2013).
Can the curves tell us if the Fed is wrong?
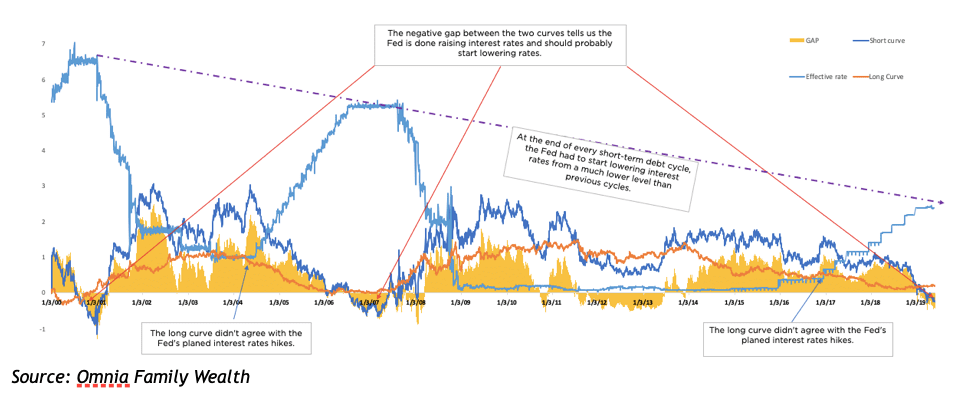
In 2004 and again in 2017, the Fed was looking to steepen the whole curve by raising the short-term rates hoping that long yields would rise as well, this would give the market the view of future economic growth/expansion and further stimulate the economy. But what happened was the long end didn’t cooperate with the Fed’s plan and started falling, and the long curve started flattening.
It was actually sending the opposite message; the long end was telling the Fed it sees weakness ahead. By not listening to the long end, the Fed actually caused the whole curve to flatten at low nominal levels.
In 2005, Alan Greenspan actually admitted in his testimony before congress the Fed didn’t understand why long-term yields are falling. (See the Testimony of Chairman Alan Greenspan.)
Rising inflation?
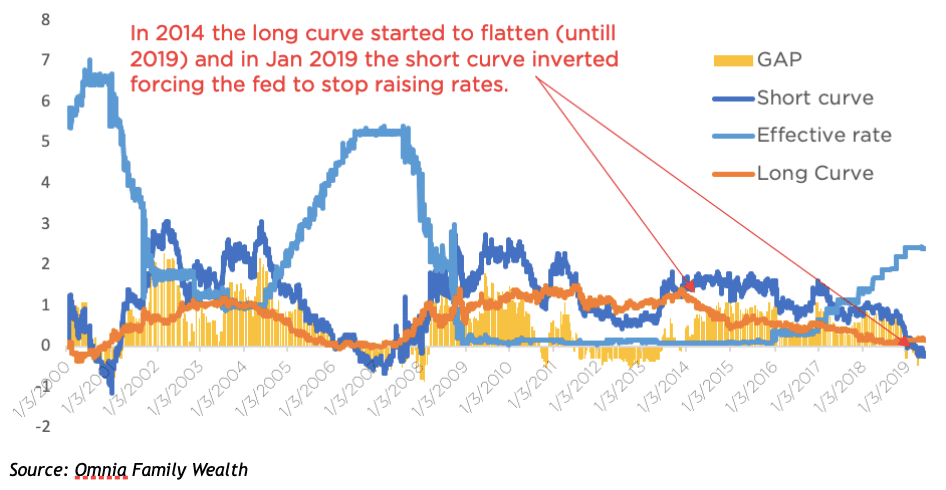
As can be seen in the chart below, in 2014 the long curve started flattening as the long end started to fall; inflation expectations were collapsing!
Still, on December 17, 2015, the Fed started increasing interest rates, to be ahead of inflation, and set its target rate at 0.25%-0.5%. It continued hiking in 2016 and 2017 until December 2018. All this time the long curve has been telling the Fed inflation risk is actually to the downside.
I would say that the Fed realized they wouldn’t be able to raise rates much longer but continued anyway, as they feared the next time, they would need to lower rates, they would do it from very low levels and be extremely limited.
What do the curves tell us today?
The situation today is similar to the 2004-2006 rate hike cycle only worse.
The Fed, believing economic conditions are strong enough to generate unwanted inflation pressures, increased interest rates 17 times from 1% to 5.25%. Its objective was to bring interest rates to the previous highs of around 6.5%, but the long curve (and long-term yields) didn’t participate in that view all the way, and in July 2006, forced the Fed to end the hiking cycle. Soon after, the short curve sharply inverted and fell below the long curve. In the chart we can see the gap between the curves turned negative indicating the Fed should start lowering interest rates.
In 2017 the long curve started flattening until the end of 2018, when the short curve inverted sharply forcing the fed to stop raising interest rates. But the current situation is worse since the Fed was only able to raise rates to 2.5% before the short curve inverted. The Fed is in a much tougher situation today.
The behavior of the long curve and long-term yields is not encouraging, they keep projecting lower yields for the foreseeable future. Japan is the closest monetary scenario we can think of, where inflation is subdued, and the central bank keeps rates low and intervening in the bond market to try and stimulate the economy.
The inability of the long curve to steepen (and stay steep) tells us there is a fundamental problem with our monetary system (not just in the US) and the solutions/tools we are used to might not be effective any longer.
Curve Interpretation
Download this commentary here.
Disclosures
Omnia Family Wealth, LLC (“Omnia”), a multi-family office, is a registered investment advisor with the SEC. This commentary is provided for educational and informational purposes only. It does not take into account any investor’s particular investment objectives, strategies, tax status, or investment horizon. No portion of any statement included herein is to be construed as a solicitation to the rendering of personalized investment advice nor an offer to buy or sell a security through this communication. Consult with an accountant or attorney regarding individual tax or legal advice.
Advisory services are only offered to clients or prospective clients where Omnia Family Wealth and its representatives are properly licensed or exempt from licensure. Information in this message is for the intended recipient[s] only. Please visit our website https://omniawealth.com for important disclosures.
This content is provided for informational purposes only and is not intended as a recommendation to invest in any particular asset class or strategy or as a promise of future performance. References to future returns are not promises or even estimates of actual returns a client portfolio may achieve.
The views expressed herein are the view of Omnia only through the date of this report and are subject to change based on market or other conditions. All information has been obtained from sources believed to be reliable, but its accuracy is not guaranteed. Omnia has not conducted an independent verification of the data. The information herein may include inaccuracies or typographical errors. Due to various factors, including the inherent possibility of human or mechanical error, the accuracy, completeness, timeliness and correct sequencing of such information and the results obtained from its use are not guaranteed by Omnia. No representation, warranty, or undertaking, express or implied, is given as to the accuracy or completeness of the information or opinions contained in this report. This report is not an advertisement. It is being distributed for informational and discussion purposes only. Omnia shall not be responsible for investment decisions, damages, or other losses resulting from the use of the information. This report is not intended for public use or distribution. The information contained herein is confidential commercial or financial information, the disclosure of which would cause substantial competitive harm to you, Omnia, or the person or entity from whom the information was obtained, and may not be disclosed except as required by applicable law.
Statements that are non-factual in nature, including opinions, projections, and estimates, assume certain economic conditions and industry developments and constitute only current opinions that are subject to change without notice. Further, all information, including opinions and facts expressed herein are current as of the date appearing in this report and is subject to change without notice. Unless otherwise indicated, dates indicated by the name of a month and a year are the end of the month.
Have Questions for An Advisor?
RELATED ARTICLES

PRIVATE CREDIT: DATA, DISCIPLINE, AND DIVERSIFICATION
Read More
IT’S TIME FOR HEALTH CARE TO PUT BRAIN HEALTH FRONT AND CENTER
Read More
PRIVATE CREDIT: OPPORTUNITY AND THE CRITICAL ROLE OF MANAGER SELECTION
Read More
BEYOND THE HEADLINES: HOW GEOPOLITICS MOVES MARKETS
Read More
TRUMP’S TARIFF STRATEGY: A Comprehensive Overview
Read More
The Exit Trap: Avoiding the Illusion of Forever Wealth
Read More
AI: Key Insights for Investors
Read More